
Question
Match List - I with List - II. Match the following filter characteristics with graph showing frequency versus magnitude along $x$ and $y$ axis, respectively :
List - I List - II A. Low pass filter I. 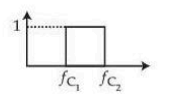
B. High pass filter II. 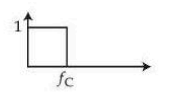
C. Band-pass filter III. 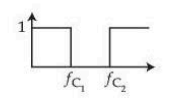
D. Band-reject filter IV. 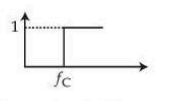
Choose the correct answer from the options given below :
The correct answer is
A-II, B-IV, C-I, D-III
To solve this problem, we need to match the filter characteristics from List-I with the corresponding frequency response graphs from List-II.
Let's explain each type of filter:
- Low Pass Filter: This filter allows signals with a frequency lower than a certain cutoff frequency to pass through and attenuates frequencies higher than the cutoff frequency. The frequency response graph typically starts at a point on the y-axis and drops to zero as the frequency increases.
- High Pass Filter: This filter allows signals with a frequency higher than a certain cutoff frequency to pass through and attenuates frequencies lower than the cutoff frequency. Its graph starts at zero and rises to a point as the frequency increases.
- Band-pass Filter: This filter allows signals within a certain frequency range to pass through and attenuates signals outside this range. Its graph shows a distinct passband.
- Band-reject Filter: Also known as a notch filter, it attenuates signals within a certain frequency range while allowing those outside this range to pass. Its graph shows a notch at the reject band.
Now, match each graph with the correct filter type:
- This graph represents a Low Pass Filter (Option A matches with II).
- This graph represents a High Pass Filter (Option B matches with IV).
- This graph represents a Band-pass Filter (Option C matches with I).
- This graph represents a Band-reject Filter (Option D matches with III).
Therefore, the correct matching is:
Option: A-II, B-IV, C-I, D-III
This matches the given correct answer.
Was this answer helpful?
Important Questions from Miscellaneous
- Which of the following relationships is/are not true?
(A). Most probable velocity = $\sqrt{\frac{2RT}{M}}$
(B). PV = $\frac{3}{2}kT$
(C). Compressibility factor Z = $\frac{pV}{nRT}$
(D). Average kinetic energy of gas = $\frac{1}{2}kT$
Choose the correct answer from the options given below - Match List-I with List-II
List-I List-II Electronic Configuration First Ionisation energy (kJ mol$^{-1}$) (A). ns$^2$ (I). 2100 (B). ns$^2$np$^1$ (II). 1400 (C). ns$^2$np$^3$ (III). 800 (D). ns$^2$np$^6$ (IV). 900
Choose the correct answer from the options given below: - The shielding constant of a 2p electron (calculated using Slater's rules) is
- Match List-I with List-II
List-I List-II Spectroscopy Property (A). Raman (I). Polarizability (B). FTIR (II). Dipole Moment (C). UV-Visible (III). Absorbance (D). NMR (IV). Spin
Choose the correct answer from the options given below: - The structure of protein comprises of:
(A). Primary structure of protein is associated with amino acids
(B). Secondary structure of protein is associated to peptides
(C). Tertiary structure of protein is associated with polypeptide chains
(D). Quaternary structure of protein is associated with polypeptide chains
Choose the correct answer from the options given below:
Need Expert Advice?


