
In the standard adjoining diagram, the measure of consumer surplus is 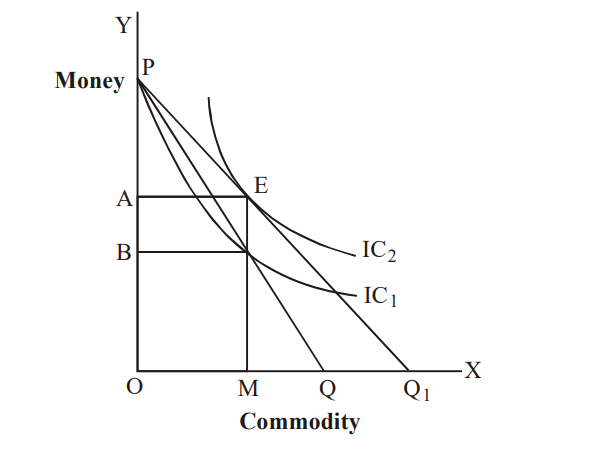
The concept of consumer surplus is integral to understanding consumer behavior in economics. It represents the difference between what consumers are willing to pay for a good or service and what they actually pay. Graphically, consumer surplus is the area between the demand curve and the price level, up to the quantity consumed.
In the given diagram, let us analyze and identify the area representing consumer surplus:
- The demand curve is typically downward sloping, as shown by the line extending from point P.
- Consumer surplus is the area above the price line (which is parallel to the x-axis) and below the demand curve.
- In the diagram, the price level consumers pay is represented by line AB.
- The maximum price consumers are willing to pay is at point P, above A, where the demand curve starts.
- Thus, the consumer surplus is the triangular area formed by points A, B, and the point P on the demand curve above A.
This area is correctly marked as AB in the diagram provided. Therefore, the measure of consumer surplus in this standard diagram is the area AB.
Conclusion: The correct answer is \(AB\), as it represents the area of consumer surplus in the provided economic graph.
Important Questions from Microeconomics
Which of the following statement is correct?
I. Indifference curves are sloping from left to right.
II. Higher indifference curve gives a higher level of utility.
If in a production process, all inputs are tripled, which of the following statements follows?
I. If the output is tripled, then decreasing returns to scale apply.
II. When the output is doubled, constant returns to scale apply.
III. If the output is more than tripled, then increasing returns to scale apply.
When it is not possible to make someone good without harming someone, then such a situation is called
According to Ricardo what condition is necessary to make possible international trade between two countries?
Match List I with List II:
List- I
Shape of revenue curve of the firm
List – II
Market structure
A.
Kinked revenue-curve (I)
Monopolistic competition B.
Infinitely elastic straight line curve (II)
Perfect competition C.
Relatively less elastic curve (III)
Oligopoly D.
Relatively high elastic curve (IV)
Monopoly.
Choose the correct answer from the options given below -


