The following table shows the percentage of marks obtained by 7 students in different subjects. Study the table data and answer the question 1 to 5 based on this data. (Here M.M = maximum marks in a subject)Percentage of marks obtained by students Subject → English
(Μ.Μ=150)Economics
(Μ.Μ=130)Sociology
(Μ.Μ=120)Philosphy
(M.M=100)Psychology
(Μ.Μ=60)IT
(Μ.Μ=40)↓ Student A 80 50 80 60 70 80 B 90 80 70 40 80 70 C 80 60 70 70 80 70 D 70 65 80 80 60 60 E 70 65 80 75 50 80 F 60 75 60 80 40 60 G 60 35 50 70 70 70
To find the overall percentage for students A and G, we need to calculate the total marks obtained by each student across all subjects and divide it by the total maximum marks possible for all subjects, then multiply by 100.
Student A Overall Percentage Calculation
First, calculate the actual marks obtained by Student A in each subject:
- English: \( 0.80 \times 150 = 120 \)
- Economics: \( 0.50 \times 130 = 65 \)
- Sociology: \( 0.80 \times 120 = 96 \)
- Philosophy: \( 0.60 \times 100 = 60 \)
- Psychology: \( 0.70 \times 60 = 42 \)
- IT: \( 0.80 \times 40 = 32 \)
Total marks obtained by Student A = \( 120 + 65 + 96 + 60 + 42 + 32 = 415 \)
Total maximum marks = \( 150 + 130 + 120 + 100 + 60 + 40 = 600 \)
Overall percentage for Student A = \( \frac{\text{Total Marks Obtained}}{\text{Total Maximum Marks}} \times 100 \)
Overall percentage for Student A = \( \frac{415}{600} \times 100 \approx 69.17\% \)
Student G Overall Percentage Calculation
Next, calculate the actual marks obtained by Student G in each subject:
- English: \( 0.60 \times 150 = 90 \)
- Economics: \( 0.35 \times 130 = 45.5 \)
- Sociology: \( 0.50 \times 120 = 60 \)
- Philosophy: \( 0.70 \times 100 = 70 \)
- Psychology: \( 0.70 \times 60 = 42 \)
- IT: \( 0.70 \times 40 = 28 \)
Total marks obtained by Student G = \( 90 + 45.5 + 60 + 70 + 42 + 28 = 335.5 \)
Total maximum marks (same for all students) = \( 600 \)
Overall percentage for Student G = \( \frac{\text{Total Marks Obtained}}{\text{Total Maximum Marks}} \times 100 \)
Overall percentage for Student G = \( \frac{335.5}{600} \times 100 \approx 55.92\% \)
Therefore, the overall percentages are approximately 69.17% for Student A and 55.92% for Student G.
Important Questions from Mixed Data Interpretation
The following chart shows the number of telephone conversations at a Call Centre for various call durations on a particular day.

How many minutes of telephone conversations took place on that day?Study the given table answer the question that follows. The following table shows the income of a person (in thousand rupees) per annum over the given years.
Year School Salary Coaching Home Tuition 2018 132 42 12 2019 148 55 18 2020 166 68 24 2021 178 74 28 2022 196 88 35 What is the average income from school as a salary per year earned by the person over the given years?
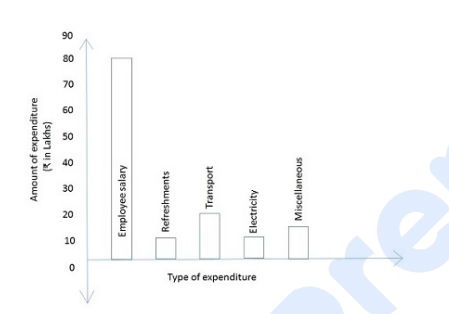
The graph shows the monthly expenditure of a company (unit = 10 lakhs). Study the graph and answer the questions.
The percentage of money spent on miscellaneous is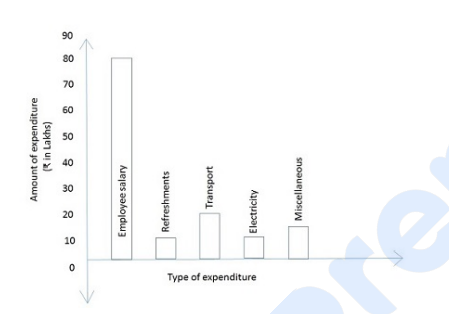
The graph shows the monthly expenditure of a company (unit = 10 lakhs). Study the graph and answer the questions.
The fraction of money spent on refreshments is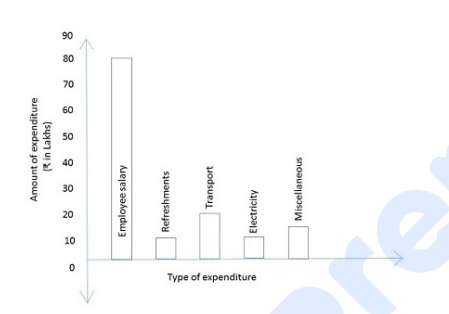
The graph shows the monthly expenditure of a company (unit = 10 lakhs). Study the graph and answer the questions.
The total monthly expenditure of the company is