
A certain country has 504 universities and 25951 colleges. These are categorised into Grades I, II, and III as shown in the given pie charts. What is the percentage, correct to one decimal place, of higher education institutions (colleges and universities) that fall into Grade III? 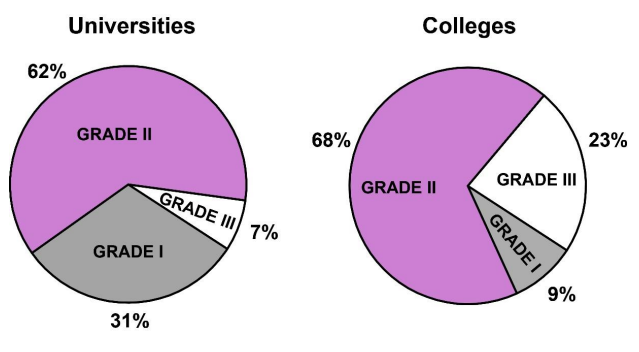
To find the percentage of higher education institutions (both colleges and universities) that fall into Grade III, follow these steps:
- Identify the number and percentage of universities and colleges in Grade III from the pie charts:
- From the Universities pie chart, \(7\%\) are in Grade III.
- From the Colleges pie chart, \(23\%\) are in Grade III.
- Calculate the actual number of universities and colleges in Grade III:
- Number of universities in Grade III: \(= \frac{7}{100} \times 504 = 35.28 \approx 35\)
- Number of colleges in Grade III: \(= \frac{23}{100} \times 25951 = 5978.73 \approx 5979\)
- Find the total number of higher education institutions:
- Total number of institutions = Number of universities + Number of colleges
- \(= 504 + 25951 = 26455\)
- Calculate the total number of institutions in Grade III:
- Total institutions in Grade III = Universities in Grade III + Colleges in Grade III
- \(= 35 + 5979 = 6014\)
- Finally, calculate the percentage of institutions in Grade III:
- \(\text{Percentage} = \left(\frac{6014}{26455}\right) \times 100 = 22.7\%\)
Therefore, the percentage of higher education institutions that fall into Grade III is 22.7%.
Important Questions from Pie Charts
The pie charts depict the shares of various power generation technologies in the total electricity generation of a country for the years 2007 and 2023.
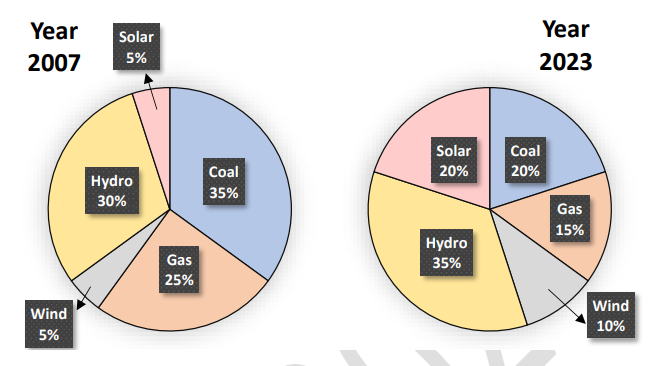
The renewable sources of electricity generation consist of Hydro, Solar and Wind. Assuming that the total electricity generated remains the same from 2007 to 2023, what is the percentage increase in the share of the renewable sources of electricity generation over this period?The distribution of employees at the rank of executives, across different companies C1, C2, ..., C6 is presented in the chart given above. The ratio of executives with a management degree to those without a management degree in each of these companies is provided in the table above. The total number of executives across all companies is 10,000.
The total number of management degree holders among the executives in companies C2 and C5 together is ________
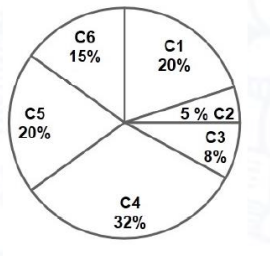
Company Ratio C1 3:2 C2 1:4 C3 5:3 C4 2:3 C5 9:1 C6 3:4 - 40% of deaths on city roads may be attributed to drunken driving. The number of degrees needed to represent this as a slice of a pie chart is
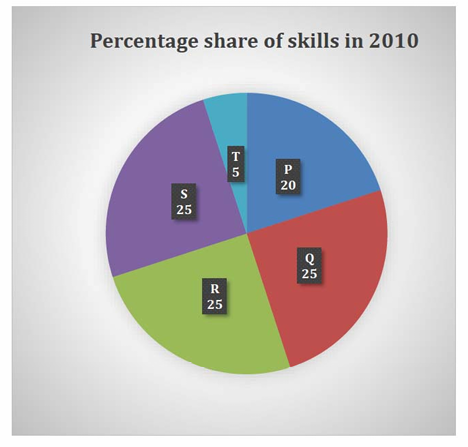
A firm hires employees at five different skill levels P, Q, R, S, T. The shares of employment at these skill levels of total employment in 2010 is given in the pie chart as shown. There were a total of 600 employees in 2010 and the total employment increased by 15% from 2010 to 2016. The total employment at skill levels P, Q and R remained unchanged during this period. If the employment at skill level S increased by 40% from 2010 to 2016, how many employees were there at skill level T in 2016?
In an election, the share of valid votes received by the four candidates A, B, C, and D is represented by the pie chart shown. The total number of votes cast in the election were 1,15,000, out of which 5,000 were invalid.
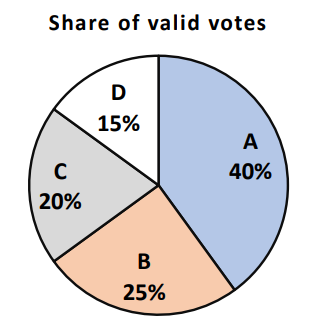
Based on the data provided, the total number of valid votes received by the candidates B and C is


