
A bag contains Violet (V), Yellow (Y), Red (R), and Green (G) balls. On counting them, the following results are obtained:
(i) The sum of Yellow balls and twice the number of Violet balls is 50.
(ii) The sum of Violet and Green balls is 50.
(iii) The sum of Yellow and Red balls is 50.
(iv) The sum of Violet and twice the number of Red balls is 50.
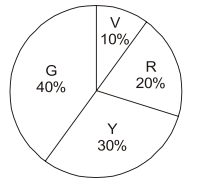
Which one of the following Pie charts correctly represents the balls in the bag?
Equations from Ball Counts
Let V, Y, R, and G represent the number of Violet, Yellow, Red, and Green balls, respectively. The problem statements translate to the following equations:
- (i) \( Y + 2V = 50 \)
- (ii) \( V + G = 50 \)
- (iii) \( Y + R = 50 \)
- (iv) \( V + 2R = 50 \)
Solving the System of Equations
We can solve this system of linear equations step-by-step:
- From equation (iii), express Y in terms of R: \( Y = 50 - R \).
- Substitute this expression for Y into equation (i): \( (50 - R) + 2V = 50 \).
- Simplify the equation: \( -R + 2V = 0 \), which means \( R = 2V \).
- Substitute \( R = 2V \) into equation (iv): \( V + 2(2V) = 50 \).
- Solve for V: \( V + 4V = 50 \Rightarrow 5V = 50 \Rightarrow V = 10 \).
- Calculate R using \( R = 2V \): \( R = 2 \times 10 = 20 \).
- Calculate Y using equation (iii): \( Y + 20 = 50 \Rightarrow Y = 30 \).
- Calculate G using equation (ii): \( 10 + G = 50 \Rightarrow G = 40 \).
The number of balls are:
- Violet (V): 10
- Yellow (Y): 30
- Red (R): 20
- Green (G): 40
Calculating Ball Proportions
First, find the total number of balls:
Total balls = \( V + Y + R + G = 10 + 30 + 20 + 40 = 100 \).
Now, calculate the proportion of each color:
- Violet: \( \frac{10}{100} = 0.1 \) (10%)
- Yellow: \( \frac{30}{100} = 0.3 \) (30%)
- Red: \( \frac{20}{100} = 0.2 \) (20%)
- Green: \( \frac{40}{100} = 0.4 \) (40%)
Matching Proportions to Pie Chart
The correct pie chart must represent these proportions: 10% Violet, 30% Yellow, 20% Red, and 40% Green.
Comparing these proportions to the options, the pie chart provided in Option 1 represents these values accurately.
The image URL for the correct pie chart is:
Important Questions from Pie Chart
Study the following pie-charts carefully to answer the questions.
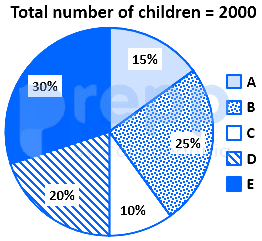
If 70 percent children from village D go to school then what is the number of children attending school from village D ?
Study the following pie-charts carefully to answer the questions.Percentage break-up of number of children in five different villages
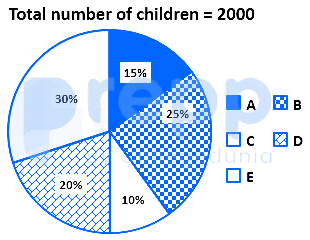
What is the respective ratio of total number of children from village A to village C ?
Study the following pie-charts carefully to answer the questions.Percentage break-up of number of children in five different villages
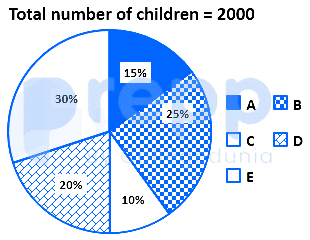
What is the total number of children in villages B and E ?
Study the chart and answer the question based, on the pie chart.The pie chart is given below shows expenditures incurred by a family on various items and savings in a month. Savings of the family is ₹ 8,000 in a month.
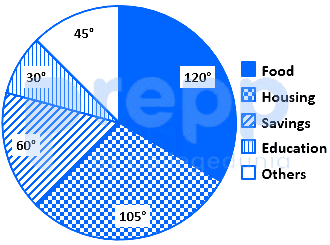
What is the total expenditure of the family for the month?
Study the chart and answer the question based, on the pie chart.The pie chart given below shows expenditures incurred by a family on various items and savings in a month. Savings of the family is ₹ 8,000 in a month.
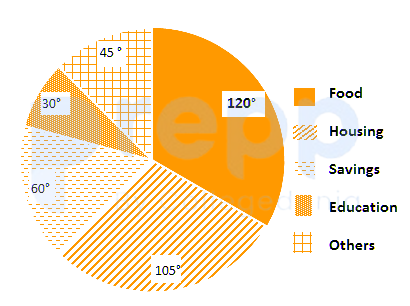
How much more amount is spent on food than on housing?


